I believe that one way to know the heart of country is to travel its length and breadth. At the same time, you can know the soul of a country through its food.
We all have certain regional or national dishes that could be classified as distinctly ours, no doubt. These specialized dishes are one marker, but another way is a walk through a grocery store.
How do our grocery stores in the United States compare to Finland? At first glance, there doesn’t seem that much of a difference. You walk into fresh produce and vegetables, a self-service bakery, rows of coolers with quick meals.
What about the pasta isle? I offer for comparison two pictures of a typical pasta sauce aisle from the United States:
Or the salsa aisle:

We all have our favorites, and the of spaghetti sauce choices seem to cater to every differentiation of tomato / chunky / smooth / roasted tomatoes / vodka sauce or for salsa heat / no heat / chiles / etc.
Meanwhile in Finland let’s look at the spaghetti sauce and salsa offerings…
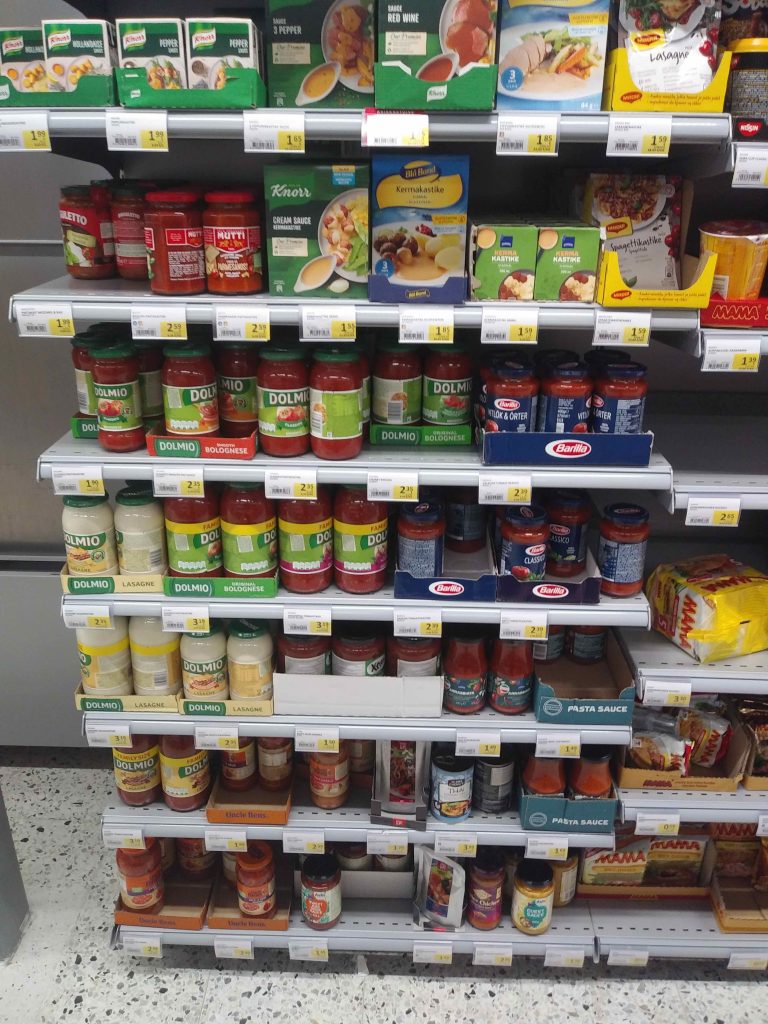
The (dearth) of spaghetti sauce options. 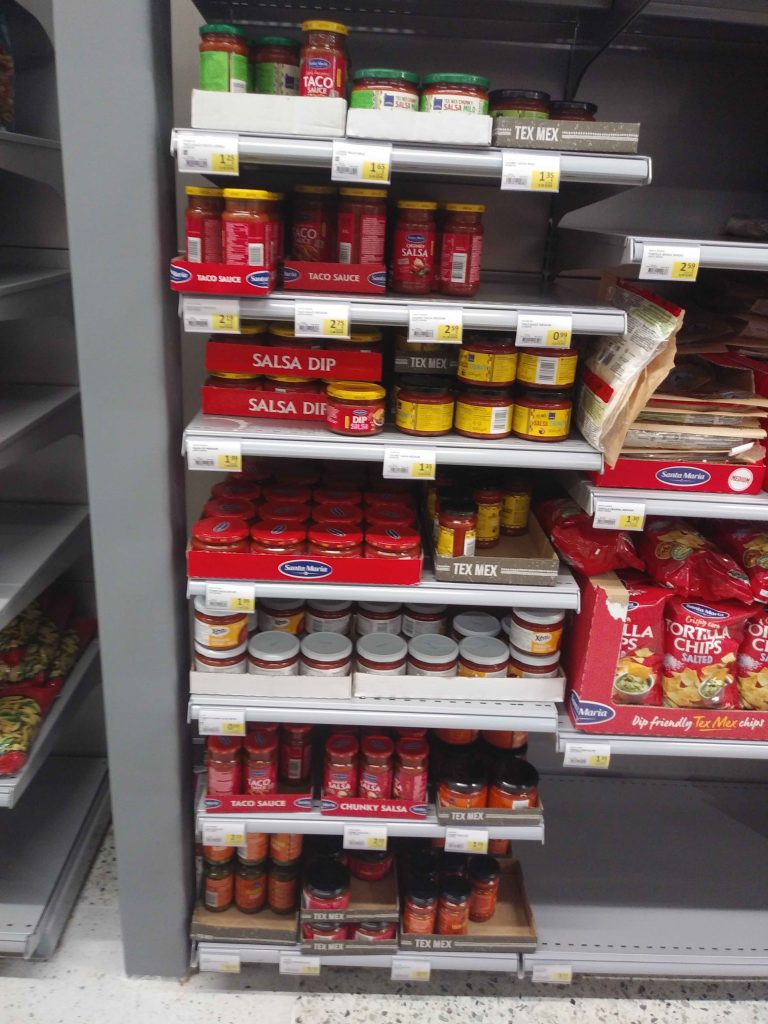
The salsa is a * little * more extensive.
(I should note these photos come from S Market, a reasonably sized grocery store you can find throughout Finland. Definitely not as large as a supermarket in the United States, but has the proportionate amount of items given its size. No, there are no Aldi’s here, but there is Lidl which is a tiny bit larger than an Aldi with a similar design / layout.)
Yeah, I am missing a good Prego Heart Smart sauce. The sauces here run a little too sweet for my liking. The salsa – well if I can tolerate the “Hot and Spicy”, that says something.
But hey, what is up with the mustard aisle (sinappi)?
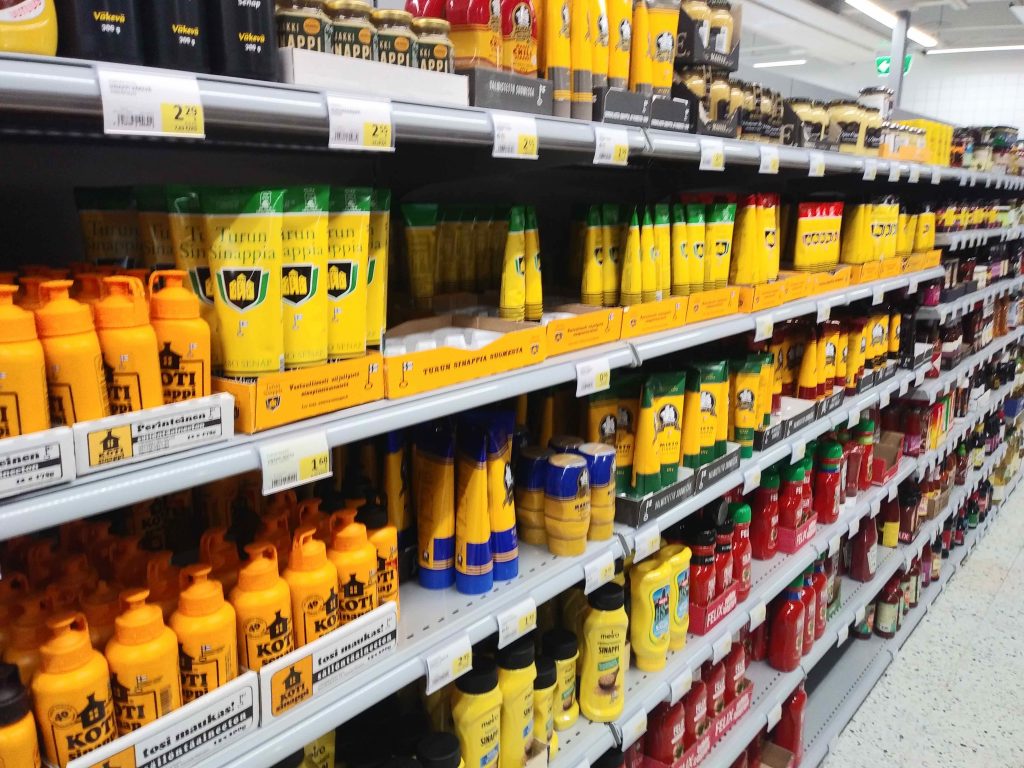
This is crazy overwhelming! You can purchase mustard for each of your tastes. Based on some cursory research (thanks Wikipedia!) here would be one reason why this is so extensive here: LINK
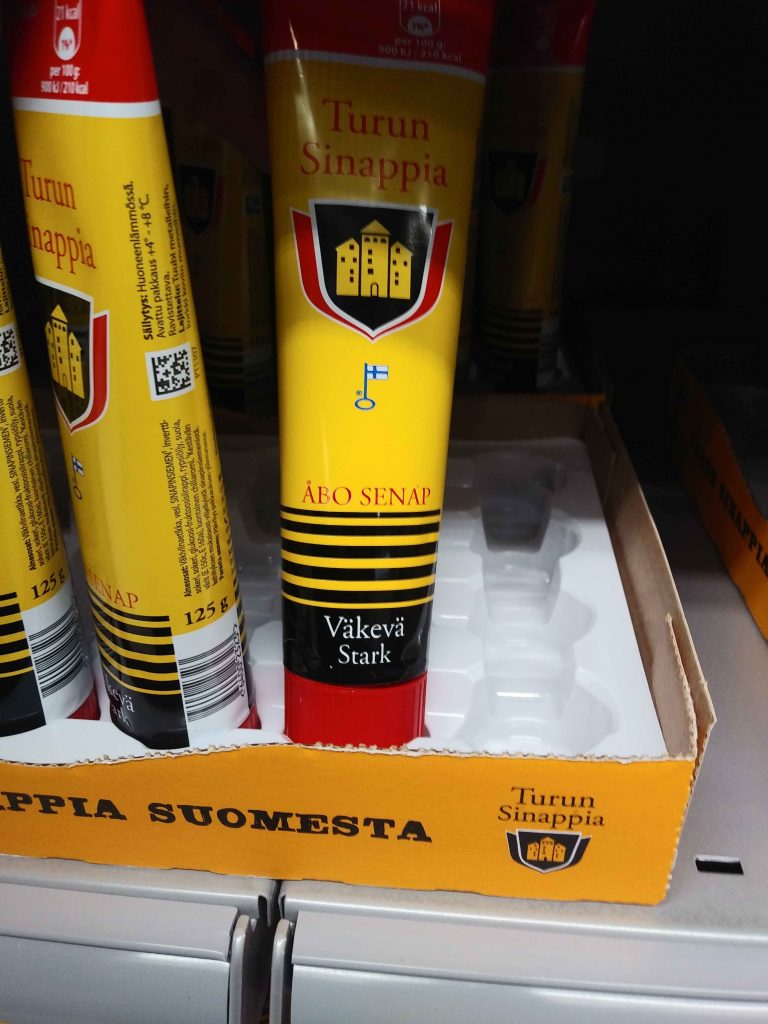
It does seem weird to purchase a condiment that looks like a toothpaste tube, but this mustard isn’t the standard flavor we would find in the US. I don’t know if we will make it through ALL the different varieties of sinappi but nonetheless
Here is a more pointed question, what does all this sinappi mean?
Something to ponder ….